Some are kept up to date, within a few days, and it is this aspect that interests me. They are easily integrated over space (regular grid, no missing data). I do so with some nervousness, because I don't know why the originating organizations like NCAR don't push this capability. Maybe there is a reason.
It's true that I don't expect an index which will be better than the existing. The reason is their indirectness. They are computing a huge amount of variables over whole atmosphere, using a lot of data, but even so it may be stretched thin. And of course, they don't directly get surface temperature, but the average in the top 100m or so. There are surface effects that they can miss. I noted a warning that Arctic reanalysis, for example, does not deal well with inversions. Still, they are closer to surface than UAH or RSS-MSU.
But the recentness and resolution is a big attraction. I envisage daily averages during each month, and WebGL plots of the daily data. I've been watching the recent Arctic blast in the US, for example.
So I've analysed about 20 years of output (NCEP/NCAR) as an index. The data gets less reliable as you go back. Some goes back to the start of space data; some to about 1950. But for basically current work, I just need a long enough average to compute anomalies.
So I'll show plots comparing this new index with the others over months and years. It looks good. Then I'll show some current data. In a coming post, I'll post the surface shaded plots. And I'll probably automate and add it to the current data page.
Update: It's on the data page here, along with daily WebGL plots.
More on reanalysis
Reanalysis projects flourished in the 1990's. They are basically an outgrowth of numerical weather forecasting, and the chief suppliers are NOAA/NCEP/NCAR and ECMWF. There is a good overview site here. There is a survey paper here (free) and a more recent one (NCEP CFS) here.I've been fosussing on NCEP/NCAR because
- They are kept up to date
- They are freely available as ftp downloadable files
- I can download surface temperature without associated variables
- It's in NCDF format
There are two surface temperature datasets, in similar layout:
SFC seems slightly more currently updated, but is an older set. I saw a file labelled long term averages, which is just what I want, and found that it ended in 1995. Then I found that the reason was that it was made for a 1996 paper. It seems that reanalysis data sets can hybridize technologies of different eras. SFC goes back to 1979. I downloaded it, but found the earlier years patchy.
Then I tried sig995. That's a reference to the pressure level (I think), but it's also labelled surface. It goes back to 1948, and seems to be generally more recent. So that is the one I'm describing here.
Both sets are on a 2.5° grid (144x73) and offer daily averages. Of course, for the whole globe at daily resolution, it's not that easy to define which day you mean. There will be a cut somewhere. Anywhere, I'm just following their definition. sig995 has switched to NETCDF4; I use the R package ncdf4 to unpack. I integrate with cosine weighting. It's not simple cosine; the nodes are not the centers of the grid cells. In effect, I use cos latitude with trapezoidal integration.
Results
So here are the plots of the monthly data, shown in the style of the latest data page with common anomaly base 1981-2010. The NCEP index is in black. I'm using 1994-2013 as the anomaly base for NCEP, so I have to match it to the average of the other data (not zero) in this period. You'll see that it runs a bit warmer - I wouldn't make too much of that.NCEP/NCAR with major temperature indices - last 5 months  |
NCEP/NCAR with major temperature indices - last 4 years 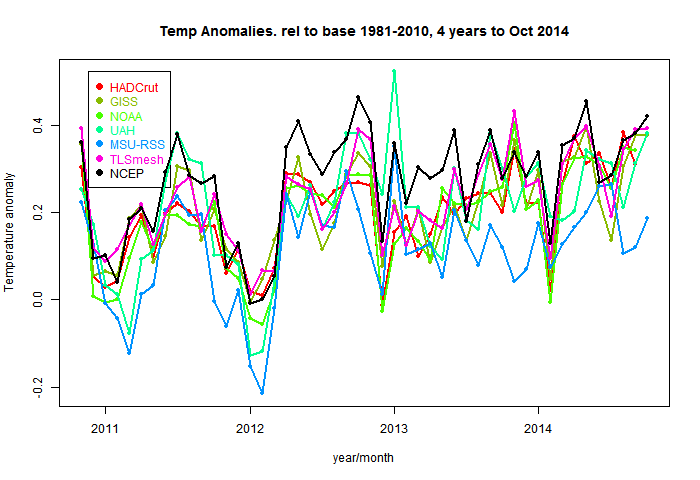 |
Here is an interactive user-scalable graph. You can drag it with the mouse horizontally or vertically. If you drag up-down to the left of the vertical axis, you will change the vertical scaling (zoom). Likewise below the horizontal axis. So you can see how NCEP fares over the whole period.
Recent months and days
Here is a table of months. This is now in the native anomaly bases. NCEP/NCAR looks low because it's base is recent, even hiatic.The mean for the first 13 days of November was 0.173°C. That's down a lot on October, which was 0.281°C. I think the reason is the recent North American freeze, which was at its height on 13th. You can see the effect in the daily temperatures:
| Date | Anomaly |
| 1 | 0.296 |
| 2 | 0.25 |
| 3 | 0.259 |
| 4 | 0.287 |
| 5 | 0.229 |
| 6 | 0.214 |
| 7 | 0.202 |
| 8 | 0.165 |
| 9 | 0.135 |
| 10 | 0.154 |
| 11 | 0.091 |
| 12 | 0.018 |
| 13 | -0.049 |
| 14 | 0.049 |
| 15 | 0.147 |
Anyway, we'll see what coming days bring.
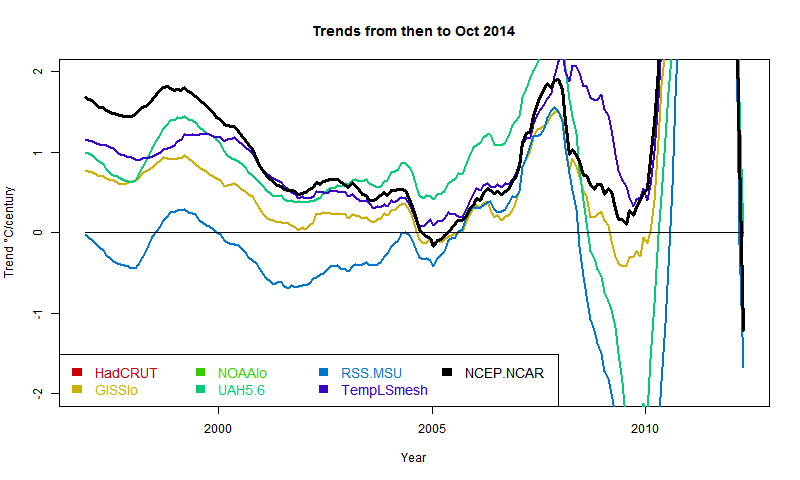
Update (following a comment of MMM). Below is a graph showing trends in the style of these posts - ie trend from the x-axis date to present, for various indices. I'll produce another post (this graph is mostly it) in the series when the NOAA result comes out. About the only "pause" dataset now, apart from MSU-RSS, is a brief dip by GISS in 2005. And now, also, NCEP/NCAR. However, the main thing for this post is that NCEP-NCAR drifts away in the positive direction pre 2000. This could be that it captures Arctic warming better, or just that trends are not reliable as you go back.


Nick,
ReplyDeleteYou mention the problems reanalyses have with inversion. I have for long been wondering, how the inversion should be appraoched more generally. I have observed often, how dramatically the surface temperatures can vary over small distances or change from influences that appear small.
A typical example is given by ski resorts of Northern Finland hills of small mountains. Most of them have so called "heat tracks" for cross country skiing just below the tree line. That may be at an altitude 100-200 m higher than the surrounding area. It's common that the temperature is -25 C at the lower altitude, and about -10 C on the "heat track".
When variations are like that for major part of the time for a couple of months, the surface temperature is perhaps not the best indicator of the climatic situation. Tropospheric temperature at a somewhat higher altitude might reflect in a more stable way the state of the atmosphere.
Another problem with the Arctic temperatures is related to the extent of ice cover. The difference between open water and snow covered ice is not presented well by the temperatures determined using standard practices.
This kind of issues have made me thing that it might be better to exclude highest latitudes from the global temperature indices even when data is available, and to handle their role in the global climate separately using some modified indicators.
Pekka,
DeleteI think it depends on how regular the inversion layers are. There are all sorts of local differences which make sites unrepresentative in absolute terms. That is one reason for focusing on anomalies. The key question is whether inversions happen with great irregularity which adds to the noise.
We have a similar phenomenon in frosty Canberra. Inversions on winter evenings are common, and several trees (eg kurrajong) struggle on the flat areas but grow well on surrounding hills.
With Arctic, sea ice is certainly a problem for the conventional measures. Reanalysis should in principle do more consistently, though the problem shifts to the assimilation stage. Cowtan and Way used, among other things, a hybrid between HADCRUT and UAH TLT. That may help there, though I think simple linear mixing is a limited solution.
One indicator of the regularity of weather patterns is given by the range of variation of winter (DJF) and summer (JJA) averages. In Finland the difference between the coolest and warmest summer since 1900 is about 5 C, while the difference for the winter months is about 14 C.
DeleteWhat's with the anecdotes Pekka? You give me a hard time over a good technical approach and then you come up with these inanities all on your own.
DeleteGolly gee, from my experience cross-country ski tracks are sensitive to whether there is a tree blocking the sun. With the wrong kind of wax, it will go from sand paper to a smooth glide in the span of a few feet.
Saying that, this really has no impact on global temperature measurements. Try to get a grip -- you are slipping and probably have the wrong kind of wax :)
I think the anecdotes are interesting. In Melbourne we don't get snow, and the winter temperatures are very stable. But summers vary a lot from day to day, and I think the averages vary a lot too.
DeleteI use an anecdote and some local weather statistics to describe an effect that might well influence significantly also the properties of high latitude mean surface temperatures. I don't know, how large the potential effects are, and I don't claim to know that. The comment is related to what Nick told about the problems of reanalyses in describing the influence of inversion as the origins of these two (potential) issues are closely related.
DeleteIssues like that (and also varying extent sea ice) have made me wonder, how the Arctic and Antarctic should be included in a global temperature index to make the index most useful, i.e. to have on index with an optimal set of properties for describing global warming. Properties that affect the optimality of such an index include in my view
- understandability also to lay people
- level of correlation with effects significant for various groups of people
- accuracy and reliability of determining the index values
- minimal noise
- long and accurate series of history data
That's not a comprehensive list, but these are some of the main points. The problems related to inversion may enter in several ways. The most likely negative influence is that including surface temperatures influenced strongly by inversion may add to the noise making short term averages of the index values less useful in detection of trends. The effect is amplified by the sparse network of weather stations in regions, where the effect is strongest.
I do not claim that I have made any strong findings. Looking at the differences between various temperature indices seems superficially to be consistent with my doubts, but that kind of subjective observation does certainly not provide reliable information, it provides only hints about issues that might be significant. It's possible that these issues have been studied carefully, as my knowledge on the state of science is highly fragmentary.
When observations are used in scientific comparisons of observations with models, consistency is most important. Whenever it's possible a choice should be made so that the variable can both be determined unambiguously from the observations and calculated form the model without any additional assumptions. As an example, if a model cannot describe inversion, the comparison should be made with observations that are not strongly influenced by inversion, whenever that's possible. When that cannot be done, additional work should be done to assure that the limitations of the model do not reduce too much the weight of the comparison.
When the models used in reanalysis cannot handle inversion properly it's likely that climate models are even worse in that. To what extent that affects the conclusions is a somewhat separate issue as many conclusions are also insensitive to errors in the handling of inversion, while some other conclusion may be more sensitive.
I would expect that this kind of problems are of the same order of magnitude as the differences between the various time series with differing coverage or way of including the high latitudes. (Same order of magnitude should not be interpreted as equal in size.)
Is this result above GISS and NOAA because of the Arctic?
ReplyDeleteJCH,
DeleteAs mentioned, I don't think too much can be made of the small difference in level because I couldn't get an overlapping 30-yr period. But yes, it could also be the treatment of Arctic, inducing a slightly higher recent trend.
It would certainly be interesting to map the differences between the 1994-2014 trends for the NCEP method and either GISS or NOAA to see _where_ the biggest disagreements lie. In areas without surface measurements (Arctic, remote regions of Africa, etc.), this could be an interesting test of how well extrapolation compares to model-reality. In areas _with_ surface measurements, disagreements could be an interesting sign of... I guess the difference between the observations fed to the reanalysis and the observations used for the surface temperature record?
ReplyDeleteHowever, I seem to remember that trend analysis from reanalysis was something to approach with caution because adding or changing instruments can introduce discontinuities. (I think this came up during discussions about the counter-intuitive Paltridge 2009 humidity trends).
Still, very interesting!
-MMM
"It would certainly be interesting to map the differences between the 1994-2014 trends for the NCEP method..."
DeleteI'll put that on the list. You can get some idea from the active graph in the post, which goes back to 1994 (and beyond, for other data).
Yes, I don't really trust long term trends. I originally tried SFC with their long term means and found all modern anomalies were negative. They had high temperatures in the early 1980's. That is why I started the anomaly base in 1994. I thought the shorter period was a lesser problem than the trend wobbles.
MMM,
DeleteI've added a plot at the end of trends going back in time, including NCEP.
Have you looked at Merra?
ReplyDeletehttp://gmao.gsfc.nasa.gov/research/merra/
Incidentally, the issue with trends is the same one that satellite analyses face. This is probably where there is currently such a large discrepancy between RSS and UAH reconstructions.
* This is probably [why] there is currently ...
DeleteCarrick,
DeleteI should look more at it. Currently I'm discouraged by HDF and the way it tends to pack everything in, so you have to download and unravel a lot just to get temp. A pain for ongoing monitoring.
But yes, I should. Thanks.
Couldn't you download all the various reanalysis products from climate explorer? In my experiences ERA-Interim is a more suitable product for comparisons - particularly in the Arctic - compared the NCEPr1 product you're using. If you note in Cowtan and Way and the supplemental material we show spurious warming in NCEPr1 in northern Canada. MERRA is good in that it is independent of surface temperature observations over land.
DeleteSimmons and Pauli (2014) have a recent paper at QJRMS and show ERA-I performs well even without assimulating surface observations compared to independent stations in the high Arctic.
Carrick,
DeleteI checked on MERRA files. OpenDAP does give daily files, which is good in principle. But they are 250Mb. And AFAICS, only to end September currently.
Robert,
DeleteI need something with a ftp address that I can write into a script for daily use. NCEP/NCAR has that.
I'm sure MERRA is good, but accessibility is a critical issue.
Nick: "And AFAICS, only to end September currently."
DeleteI believe there is a delay for it compared to the surface temperature records (probably this is wise,if it implies more data cross-checking before use). Of course NCDC and HadCRUT haven't reported past September either, so a bit of a delay is expected.
The problem with Climate Explorer isn't that it is an HTTP interface, but that it uses hidden arguments (so it's not super-easy to decode and pull data). I can write automated data scrapers just fine using WGET/CURL and HTTP. If I really cared, I could decode ClimateExplorer, but currently it's more work than I care to do.
Anyway, here is what I know about MERRA:
In practice, you can grab daily files (up to the most recent available date), and select only a subset of the MERRA record using this interface. You can also select NetCDF format with that interface.
For example, this command grabs the surface temperature data for 2014-09-30.
You still have to parse the HTML to get the link, which isn't very hard (it is a link to a file ending with ".nc" in this case).
But this can all be automated.
Anyway the resulting file from this is a 18 MB file, which is much more manageable.
The part I don't know how to do is check for data availability, but I haven't worked very hard on it either.
Also, I have to use CURL to access this data because of the length of the argument is too large for wget.
Thanks, Carrick,
DeleteI tried it, and it worked, manually. But I can't see how to automate. I grabbed the long search URL and modified it, but it popped up a window, requiring selecting a URL. Your string did the same. Maybe I could automate that.
But the dates are a deal-breaker. I don't want another late monthly - I want something for the current month that nothing else is telling. NCEP/NCAR does that.
It is very easy to automate stripping out the file names. Use the first pattern to generate the date request:
Deletecurl -o files.html -O `cat <i>pattern</i>.url`
This command will output all of the files found:
awk '/click on the link for each file to be downloaded/{ init = 1; }/<a href=/{ if (init) { gsub(".*href=",""); print $0 }}/<\/table>/{ init = 0 }' files.html
It's easy to use this inside of a script. I believe I can generate a sample shell script that does this, if you're interested (pick bash or tcsh). You'd supply the starting date and ending data, and it would download all of the data for that period. It's easy enough to call the command-line from R, so even if your driving script is in R, this shouldn't be a problem.
If you ask for too recent of a date, you'll just get zero "eligible" files, so I don't see this being particularly a difficult problem:
Just start with the last good day + 1, and ask to the current date. Then download all of the files it generates.
I didn't mean to literally produce the initial > … < pair shown in the curl command. Really it isn't even necessary. However you do need double-quotes. So the first command should read:
Deleteurl -o files.html -O "`cat pattern.url`"
Which works assuming you've stored your date-range specification in a file called "pattern.url".
Oops < … >
DeleteI went ahead and created a script. It's located at this link.
DeleteI used tcsh, because that's the scripting language I normally use for this sort of task.
Sample usage:
merra_grab_dates.sh 2014 09 29 2014 09 29
should produce the output file name MERRA300.prod.assim.inst3_3d_asm_Cp.20140929.SUB.nc
Since the file name has the date encoded in it, it should be pretty simple to process from there.
Also, Cowtan and Way 2014 have a nice hybrid method that combines MERRA with the surface record.
ReplyDeleteI wasn't very happy with the way they used UAH to infill the surface record (technically my issue is with the model they used, and not the fact they were using UAH). I think the MERRA+surface temperature hybrid method is intrinsically a much better approach; one that shouldn't depend on long-term stability of the baseline in the reanalysis series.
I've added two more days data to the November table. The temperature seems to be recovering somewhat. It does seem to be due to the N America freeze.
ReplyDeleteNick, obviously November cools anyway as there is less sunlight. But how can the globe cool because gawd has selected out the USA for punishment for the recent election? Where did the USA warmth go to that it is no longer detectable by the measurement system?
DeleteNick - obviously November gets colder anyway because of the seasonal transition. The cold air was in the ~Arctic. It was part of the SAT. It came down here and displaced warm air, which went somewhere. I know because I just happened to be driving from South Dakota to Texas on the days it was happening. So explain how the exchange of air between areas of the surface results in anomalous cooling?
ReplyDeleteI think it works like this:
DeleteCold dry air tends to produce clear nights with fewer clouds. So moving cold air south will tend to reduce percent cloud cover, and increase radiative heat loss.
It's not just the US that was affected. Hawaii also saw below freezing temperatures at some locations.
JCH,
Delete"It came down here and displaced warm air, which went somewhere."
It did, but maybe not so much covering so much surface. You can't really use conservation arguments for a 2D subregion of 3D.
It's going to be interesting to see how the month comes out.
ReplyDeletehttp://kyweathercenter.com/wp-content/uploads/2014/11/GFS6.png
Nick---I updated the script slightly (it's redundant to use both -o file and -O in curl commands).
ReplyDeleteAnyway, it appears that currently October 31 is the most recently available day for MERRA.
Thanks, Carrick,
DeleteI'll experiment. I'm currently on Windows, but I shouldn't have trouble duplicating that functionality with R. Or I can fire up cygwin. Oct 31 is not ideal, but better.
I had a chance to look at the outputs… and these are for the 3-d field. Reading the documentation, I realized I needed to have been downloading the t2m field from the tavg1_2d_slv_Nx product.
DeleteAnyway here's the t2m script:
link
I verified that I was getting a rational product from MERRA by generating a sample image:
ReplyDeleteImage
Anomalized versions of this would be interesting.
I know how to generate representative climatology fields using NCEP. Haven't worked out an automated way to do this with MERRA yet.
Just for giggles, I generated a 31-day movie for October 2014.
ReplyDeleteMy work here is done. [™]
Thanks, Carrick,
DeleteI couldn't run in browser, but OK after download. It seems to be hourly data.
Carrick, that is very cool. Is that the sun sweeping by?
DeleteNick: Yes, this data is hourly and high resolution (540x360).
DeleteJCH: Yep, that's the sun heating up the surface. Notice that air above land heats up much more than above oceans. Mountain ranges are very visible too.
Proof positive that the sun does not heat the oceans!!!! Lol. I think it's a neat tutorial for lay people.
DeleteNOAA reported today for October, +0.74. So by its count the warmest year record is almost guaranteed - only need +0.98 between Nov and Dec.
ReplyDeleteDK - I was looking at last year, and it was second warmest through October. It dropped to 4th place after the polar vortex made its appearance in the news. But I think you're right. I think December will be warm because ENSO ONI is moving up into positive numbers.
ReplyDeleteNick:
ReplyDeleteReally late to the show, but hope you see this comment.
Sigma refers to the vertical coordinate used. In a sigma system, which is used in reanalysis 1 and 2 (NCEP), the vertical levels are represented as fractions of the surface pressure. Sigma 0.995 (which is what sig995 means) represents a level that is at 0.995 of the surface pressure. For something at standard sea level pressure, 1013.25 mb, that's about 50 meters above the surface.
I wouldn't worry about temperature inversions above sea ice. The conduction through the ice pack, or heat flux from the fractions of exposed water, will destabilize the attempted inversion.
An issue for the NCEP reanalysis 1 or reanalysis 2 is that sea ice does not have concentration -- it is 100% compact, and 3 meters thick (too thick for modern ice, though ok for older periods). The CFSv2 Reanalysis (Saha et al 2010, Bulletin of the AMS) has ice concentration and thickness. Since you seem most interested in the more recent era, I would definitely use this rather than the older systems.
Thanks for the explanation - I had expected it would be probably the mid of the surface grid level in pressure coords.
DeleteFrankly, I'm not too worried about fine points (inversions, sea ice etc). I use the index for between months guidance - have recent days been warm or cold? I wouldn't use it to supplant the surface measures. I do watch CFSv2. I'll check again following your suggestion re CFSR.
Earlier this month your NCEP reanalysis bottomed out at 0.02, a hair's breadth away from going negative for the first time in 18-ish months. Then it turned on a dime and is now back up at 0.764. That's the biggest two-week rise in the entire 1993-2017 history of your data set. (The biggest two-week fall was of similar magnitude, in Dec 2015).
ReplyDeleteSeems like there's a lot of variability right now in the reanalysis data. I wonder where it's headed next?
Ned,
DeleteYes, it's remarkable, isn't it. I think the dip was mainly the exceptional cold snap in N America and E Europe/Russia. I think the dip/peak pattern generally is interesting; there seems to be a repeated sequence with a period of a few days.
You can see the very cold areas on the globe map next down.
Bryan mentioned it was going to happen, and it did. And I mentioned it was going to get hotter because ONI was predicted to go up during Jan, and it has. GMST sort often follows ONI around like a slave.
Delete