WebGL is implemented by GPUs (graphics processors) in a highly parallel system. It is programmed initially in Javascipt, based on an HTML5 canvas element. But it requires "shaders"; fragments of code to be distributed with data onto those processors. I think WebGL handles all this very well, but it can get complicated. Here is a TOC for this page:
- Background
- File Structure
- User Files
- Objects and types
- Data Properties
- Colors and Appearance
- Active features - tags
- Triangle nodes and edges
- Multiple Data
- Global Parameters
- Gadget control and operations
- Altering and entering data
- Examples
- Data and Code
- Index of keywords
- Notes for V2.1
Background
The MoyGL system seeks to automate all this on a program called MoyGLV2.js. All the user has to do is supply problem data and some control parameters on a user file. I described early versions of the system here, early 2014 and here (simplified). Three years later, I described an update here, which I called V2, and gave a number of applications.The system isn't restricted to spheres, and I showed a visualisation of harmonic surfaces here. But some of the supplementary facilities only make sense with a unit sphere, so in this latest vetsion there is a paeameter allowing sphere assumptions to be varied. Being a Javascript facility, the code is anyway public, but I'll attach a zip file to help its use. I embed apps in Moyhu blog pages, but I also run it locally, often from local files. The basic requirements are:
-
A HTML stub, which can either be run stand-alone or embedded. This has just a single hook for the Javascript:
<div id="PxBody" /></div>
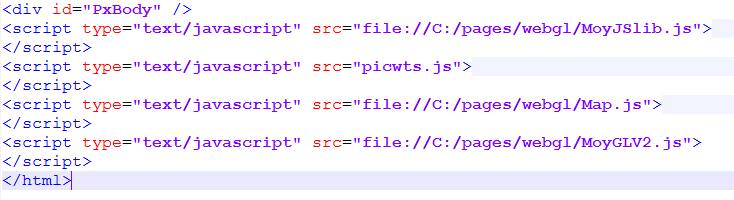
The ID is recognized by MoyGL, which builds a tree of HTML elements based on it. Then there are the - script calls. Here is an example from a recent post:
<script type="text/javascript" src="https://s3-us-west-1.amazonaws.com/www.moyhu.org/pages/webgl/MoyJSlib.js"> </script>
<script type="text/javascript" src="https://s3-us-west-1.amazonaws.com/www.moyhu.org/pages/webgl/Map.js"> </script>
<script type="text/javascript" src="https://s3-us-west-1.amazonaws.com/www.moyhu.org/2017/03/picwts.js"> </script>
<script type="text/javascript" src="https://s3-us-west-1.amazonaws.com/www.moyhu.org/pages/webgl/MoyGLV2.js"> </script>
The first is a small library file, which I use very little so far, but expect to use more. I'll write more about it. The second is data for adding a map, if wanted. The third is the user file for the app (see next section), and that is what I will expand on here. The fourth is the executable JS, which must therefore be placed last. And that's it.
User files
These take the form of a Javascript function. If you aren't familiar with JS, for everything here C syntax will probably be OK (they are very similar). An influence on the way things are structured is the need to minimise global variables. In fact, there is just one per file (inevitable) and the PxBody tag. The functions in V2.1 will be called respectively MoyJSlib(), MoyMap(), MoyDat() and MoyInit().(Update - these had been called PxDat etc, and this name is still extant on old user files. Now either PxDat or MoyDat (preferred) should work). These should be the only global names.The Javascript MoyDat function contains the data. The basic form is
function MoyDat(p,U){
....
}
p is the handle of a set of objects, corresponding to WebGL objects, and U is an object defining some global variables. The body of the function defines user objects and properties.
Objects and Types
Defining an object, say Mesh (which I'll use as an arbitrary user object name), is simple:p.Mesh={}
Typical objects might be a triangle mesh, a set of points for nodes, or a line object for a map. You will be able to see the objects you declare in a checkbox list top right. You can toggle them on/off with the boxes.
Then you can add object properties, which are mainly data. The first essential attribute is a type, corresponding to WebGL types. The syntax is:
p.Mesh.type=U.TRIANGLES // note the U.
The basic types are POINTS, LINES and TRIANGLES. The type determines how the node data that you supply will be connected. Other types, which are alternative ways of linking the data, are LINE_STRIP, TRIANGLE_STRIP, and more rarely, LINE_LOOP and TRIANGLE_FAN.
I have added two extra types:
- U.MAP, which crates a LINE_STRIP object from a file called "Map.js" (see above). With this type, you don't need to supply extra data (but you can).
- U.GRID - see next section. It makes a triangle type with a lat/lon grid.
Objects have properties, which can be prescribed or inherited. Prescribed have priority; defaults are inherited. There is an explicit inheritance
p.Mesh.from=object name
But with the multi and edge facilities below, I don't use this now.
You may see reference to an object discM. This is a disc placed across the mid-plane of a sphere (if U.sphere>0, see below) to make it opaque for maps etc. You can make it disappear with a checkbox.
Data Properties
The standard data supplied are:- p.Mesh.nodes=[...]
Between the brackets (JS for arrays) are a string of floats separated by commas. The numbers are generally the cartesian x,y,z components of successive nodes. But if .sphere is enabled, as it is by default (see below), you can supply lat/lon in degrees, or xyz on the unit sphere. - p.Mesh.vals=[...]
These are needed to determine colors for color shading (triangle elements). The values, one float per node, are again a flat comma-separated list. They will be converted into integer pointers into the palette, usually 256 colors. A color key will be generated. Alternatively you can give the integers directly:
p.Mesh.cols=[...]
Monochrome points and lines do not generally need vals or cols specified. - p.Mesh.links=[...]
This set of integer pointers into nodes says how they will be connected, and depends on type. Remember, JS always numbers from zero. Sometimes this can be omitted, as with POINTs (no connections) or LINE_STRIP, where if no links are specified, it will just connect in the given order (use NaN pairs to break). But for TRIANGLES, give pointers in groups of 3, and generally for LINES, in pairs. For more complex types like TRIANGLE_STRIP, follow the WebGL sequence.
Even for POINTS, you might want to give links to specify a subset. I should note here that where two objects have common data, you don't have to supply twice. You can just write a.nodes=b.nodes, if b.nodes has been supplied. in JS, a.nodes is then a pointer to b.nodes, not separately stored data. You need to be aware of this if b.nodes data is later changed, but it probably won't be. It is for such reassigned data that selecting a subset by pointers can be useful. - GRID type
As mentioned above, you can declare this when you want to shade a lat/lon grid with square cells. You supply only .vals (or .cols); the system will work out the nodes and links, you can have a wide variety of sizes, from 1/4° up, as long as it is a divisor of 180. The order is longitude varying first, then latitude. In latitude, with 5x5° say, you could give 35, 36 or 37 levels. 36 would be interpreted as mid values (-87.5, -82,5 etc), 37 as bottom corner (-90, -85 etc), and 35 the same, but omitting the poles.
With GRID, you can't ask for edges or nodes to be marked, though you can make an extra object to do it.
Colors and appearance
The basic color palette statement isp.Mesh.palette=[...]
where the palette is a set of typically 256 RGB triples, in the GL style, ie each between 0 (no color) and 1 (full). I described here an abbreviated form for continuous color shading. There are defaults for triangles (rainbow) and points/lines (grey). For monochrome the palette can be just one RGB triple, and no vals or cols are needed. Otherwise the palette is used by the .cols property (pointers into palette), which may be deribed from .vals.
Each triangle is shaded RGB interpolation from the colors assigned to the corner nodes. If you want a node to have different colors in different triangles, give multiple copies of the coords, with corresponding pointers (and vals/cols). The colors of the first shaded object will be used to make the color key, if you have supplied .vals. You can comtrol the heading by
U.units="deg C"
or whatever.
The colors are made from .vals, if supplied, by a non-linear function from all reals to the range (0,1), which is then scaled to the palette range. The function is usually tanh((v-m)/s), where v is value, m is mean, and s is standard deviation. The sd has no statistical intent; it is just a scaling. One effect of this is that the color mapping will vary with every plot. You might want to make it consistent. There is an object property:
p.Mesh.norms=[m,s]
where m, s are floats; if this is supplied, it will take precedence. You can make this multi-valued.
You can't control linewidth (a WebGL issue) but you can control point size p.Mesh.size=..
Default is 3; this is point size in pixels. You can attach this to a triangle object, and if you ask for nodes (see .edge below), that will be applied.
You can control headings that are displayed. This involves adding properties to U:
U.long="MyHeading" and
U.short="MyHead"
The long heading appears top left; the short is only useful with Multiple Data, when it gives the headings for the radio button table.
There is a parameter .alt which you can set to raise one object above others; it is 1 for the surface (r=1). The object parameter .alpha, between 0 and 1, governs transparency (1 is full color, 0 fully transparent.)
Active features - tags
I'll describe below how you can rotate the globe and zoom. But if you click at any point on it, you'll see a number pop up under the object list. That has the .vals value for the triangle object, if this has been supplied. Usually there is only one such object. The number is the .val at the nearest node.But you can improve on this by supplying a list of tags (eg place names). There are just a vector of strings, one for each node. They will be displayed with the data.
p.Mesh.tags=["..","..",...]
Triangle nodes and edges
I often want to show the edge lines and nodes for each triangle. For that you need a new object (different type). However, the system will make those automatically if you setp.Mesh.edge=3
(for triangles). The values here are 0 default, 1 add points only, 2 add edge lines only, and 3 add both. You'll see the new objects in the checkbox list, as Mesh_P and Mesh_L respectively. You can toggle them on/off. The _P object inherits size and tag from its parent Mesh.
Multiple Data
This allows you to combine several data sets with common features to give alternative displays. You can do it by taking any data item, such as .vals or .palette, and offering an array of values. Vectors can be nested, egp.Mesh.val=[[...],[...],[...]]
You will usually have some properties multiple and some not. It is best to ensure that any multiple vectors have the same number of components, else confusion. A table of radio buttons with labels will appear lower right. The buttons let you choose which group to show. It is best to use the U.short parameter above to label these, also supplying an array of strings.
U.short=["..","..",".."]
Global Parameters
I have been introducing the U object, which supplies data (type numbers) and to which you can attach more. Some useful ones are:U.sphere = -1|0|1|2
This determines what assumptions will be made about whether you are using a unit sphere. 0 makes no assumption; 1, the default, means you can supply lat/lon which will be mapped to the sphere, and also makes sense of the clicking to show values qv
Value 2 is more ambitious, and ensures that triangles and lines will follow surface curves, if they span more that 5° for lines or 10 for triangles. That is, the sections get divided, with extra nodes projected onto the sphere. These extras don't count for edge showing or value clicking. It involves quite a lot of extra calculation, and tend to make bits of lines disappear, so use only when needed.
Value -1 has the functionality of setting U.flat=1 in the previous account. It maps the sphere onto a flat lat/lon plot (in degrees), still using WebGL shading, but you can't rotate any more, though you can zoom. You can still enter coords as lat/lon or 3D cartesian, and set .edge so show lines and points.
Gadget control and operations
I have described these many times. The Earth is a trackball, drag with the mouse. The Orient button rotates the facing disc so that the longitude through the center is vertical. Dragging the right button vertically zooms or shrinks. I have explained the radio buttons and checkboxes above.Even if you aren't using sphere, the dragging and zooming is as if you were dragging a surrounding unit sphere with fixed centre.
There is an inheritance property for objects:
p.Mesh.from=p.Mesh0
Properties from Mesh0 then become defaults for Mesh. Mesh0 needs to come first. The main use for this was creating line and point objects for triangle edges, but that inheritance is now automatic with .edge.
The property
p.Mesh.show=0|1
governs whether p.Mesh is drawn - it is what the checkboxes toggle. Mostly used to make objects initially invisible (=0).
Altering and entering data
You can modify/enter data with the program running. Using the boxes top right, there are two ways:- You can select a property in the top box, and enter its value as if the RHS of something in the user file, in the text box below. That is, just a comma separated list of reals or strings. If you refer to a multi-value property, it will go into the level curently selected with rdio buttons.
- You can also enter an entire line that could have gone into the user file (with p. and U., but don't define new objects). Or even multiple items separated by ;.
Examples
I have posted many examples of use of this facility during its development. In roughly reverse order (newest first)- Global average, integration and webgl. This used most of the features of that latest version. I'll show it again below for reference.
- Temperature residuals and coverage uncertainty.
- Making an even SST mesh on the globe.
- Moyhu WebGL interactive graphics facility, V2. This describes my beta version of a few weeks ago, with code examples. I think most code will still work, though U.flat=1 has been replaced with U.sphere=-1.
- Playing with palettes in WebGL earth plotting. The first use of multiple data.
- Spatial distribution of flutter in GHCN adjustments
- Spherical Harmonics Displayed I mentioned this above as a case where the display is not of a sphere surface, although the SH surfaces are within a unit sphere.
- and many other examples uusing V1, including the following maintained pages:
- WebGL map of past GHCN/SST station temperatures. This shows monthly TempLS temperature residuals. It's the best place for detailed recent information.
- WebGL map of GHCN/SST station temperature trends
- HiRes NOAA OI SST with WebGL and Movie This actually isn't done with the system, but is the most detailed WebGL (1/4°) that I have done.
- WebGL code - shaded grids and maps. This was one of my posts from 3 years ago on V1. It had an early textbox input.
- Generic code for WebGL Earth data V1 described, with code
- Using WebGL for Earth data mapping. Setting out the ideas, and some description of WebGL.
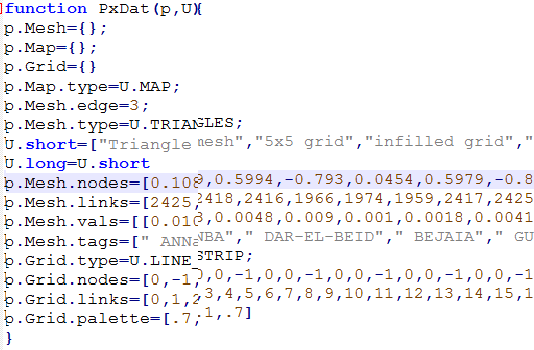
Here is the corresponding user javascript (truncated):
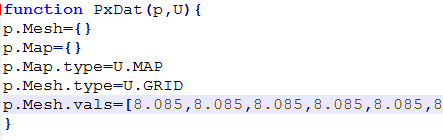
Ade here is an even simpler user file, just using the GRID type, with vals being the data for shading listed from (-90,-180), longitude first.
And here is the actual output from the picwts.js file, same as here:


I am slowly getting there but it is a struggle! I had assumed the coordinate system was Z vertical through North Pole - but now I discover that Z is pointing along the equator pointing at the date-line. Am I right?
ReplyDeleteClive,
DeleteYes. The idea is that x and y are as you see them on the page, and z is out of page (RH rule)
You have done a brilliant job here!
ReplyDeleteIdeally I would like to colour triangles as the average of all three vertices rather than interpolate colours between vertices, because that gives a speckled effect. I calculate this average and can specify a colour index 1:256. I already managed to change the colour table but your code seems to be node dependent. Is that right?
Thanks Clive,
DeleteThere are two ways you can break the continuous shading that is default. One I described in the icosahedron post. You can have separate nodes with the same coordinates (which you have to specify multiple times). So they can uimply different colors in diffreent triangles.
With a bit of Javascript, you don't have to write out the nodes multiple times. You can write
var a;
a=[...] //(each node coords once)
p.Mesh.nodes=a.concat(a,a,a,a) // gives 5 copies.
p.mesh.vals=[...] //a different entry for each copy
p.mesh.links=[...] // points into the multipole set
The other way, if you want just monochrome triangles with a few colors, is to make multiple objects:
p.yellow.nodes=[...] //full set but no need for copies
p.yellow.links=[...] // just yellow triangles
p.yellow.palette=[1,1,0]
p.red.nodes=p.yellow.nodes // pointer equivalence, not copy
p.red.links=[...] //just red
p.red.palette=[0,1,0]
p.red.palette=[0,1,0]
Deleteoops
p.red.palette=[1,0,0]
Clive,
DeleteI see that I had documented a new naming system, MoyDat() etc, while what was implemented was the old PxDat etc. Hope that didn't cause a problem. Either name should now work.
That's OK. I have it nearly working with my palette, but the example you give above is coloured according to the area coverage of triangles and NOT the provided vals (temperature). I can't immediately see how to change that.
DeleteI understand now that the problem is that the scaling in temperature is automatic. Can I somehow set the temp scale to +10c to -10C ?
DeleteClive,
DeleteThe temperature scale is from -Inf to Inf via a tanh transform - tanh((T-m)/s), where default m is mean and s is sd. You can't easily change the range but you can set m and s
p.Mesh.norms=[m,s] (floats for m,s)
So you can put -10 and 10 anywhere you like in the scale, eg m=0, s=10 will put 10 to about .84 (relative) and -10 to .16.
You can always work out your own color scale by supplying cols instead of vals
p.Mesh.cols=[...] (integers points into palette)
but then it won't give labels on the color scale. You can also trick the system by reversing the transform - supply vals as m+s* atanh(T).
If there is interest, I could enable users to write a JS function instead of the tanh.