For now, I want to follow the recent post in relating TOBS to fundamentals. What is our measure of average temperature over a period? Sometimes people strenuously urge that the usual TAVG, the average of daily recorded min and max, should be replaced by a proper integral over the day. And they would be right, if we had the historic data. But we don't.
What we do have are records of min and max as recorded daily (at various times of day) by min/max thermometers. These give not the actual daily min/max, but the min/max in the preceding 24 hours (with regular resetting). So they are, averaged over time, a reasonable measure of average temperature, but a measure that depends on the time of observation.
Let me show that with a plot of the three years of Boulder data. I have taken the mean of the hourly data, and compared with the measure that a notional observer would report from reading a min/max every day at at 2AM, or at 5AM and so until 11 pm. I show the 365 day centered running mean that you would get by each of these schemes. The running mean removes the seasonal cycle. The legend shows the colors, with a link to the respective curves. Left axis °F, right in °C. x-axis days after 31 Dec 2008.
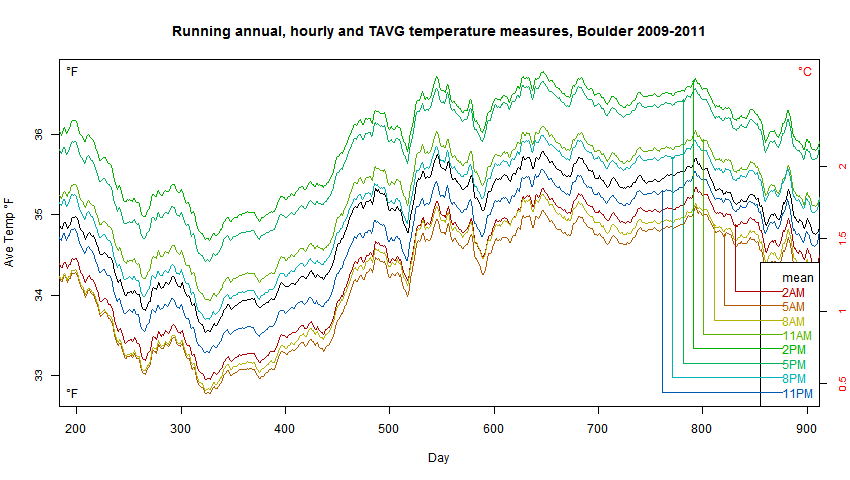
So the various TAVG curves are reasonable measures, in that they track the black mean curve with a roughly constant offset. But the offsets are very dependent on time of obs.
If you stick with one such measure, the offset does not matter much. Its effect would go away on taking anomalies. But if you switch between measures (change TOBS), the effect can be large.
TOBS adjustment is effectively calibrating this measure, relative to a reference. If you change measures, you have to recalibrate.
When we refer to "raw" or "unadjusted" monthly data, it should be remembered that it is not just the original readings. It incorporates an averaging procedure. The outcome of that depends on the time of observation. If that changes, then it's a different measure, as much as if you changed to a differently calibrated thermometer.
Below the fold, I'll show some plots of monthly averages, and a difference plot that may make the stability of the TOBS dependence clearer.
Here now is a version of the above plot shown as differences from the hourly mean. You can see that the curves generally remain in order as TOBS varies, but the spacing is not constant. TOBS adjustment will not be precise year-to-year. But fortunately for most applications, a number of years will be averaged. And there is a lot more hourly data available near most places, so an accurate mean adjustment can be derived.
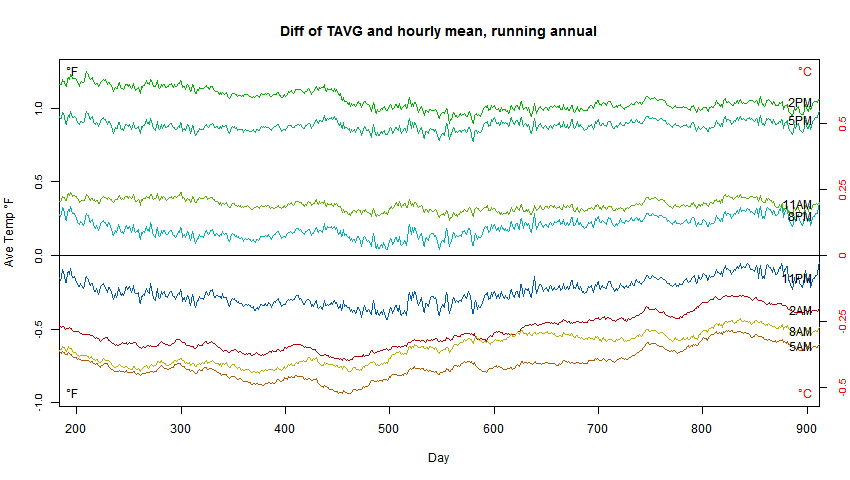
The "coolest" measure is at 5am, when it often happens that a cold minimum is split and attributed to two separate days. 8am is similar but 11am is already on the warm side of neutral, and 2pm is the time most likely to split and double count warm afternoons, making a warm bias. 5pm is a bit less so, and 11 pm has a slight cool bias relative to hourly.
You may wonder about monthly means. I showed annual first, because the seasonal cycle is so large. In fact, although the various measures fluctuate a lot more, changing the axis to accommodate seasonality makes them look a lot smoother. Here is the plot:

The extra noise is apparent when plotting differences from the mean. Here is how it looks:

It's natural to look at that and say that we should have no truck with such noise. But it's part of the actual measure that we are using. That's how the min/max varies relative to the hourly mean, which we'd certainly use if we had a long record of it. One day we will.


Nick,
ReplyDeleteThis is a wonderfully informative post. Your last graphic showing diffs between TAVG and hourly means looks noisy but is it really just noise? Hoping you'll cut me some slack for my naive understanding of the terms of this areas, is it not possible that what you show could be the basis of error bars in the TAVG reports for which we lack hourlies? Obviously error bars would be imputed in the absence of hourlies for those TAVG, but error bars are inexact in any case, or are they?
JF,
DeleteThanks. I thought the last fig was interesting in showing, for example, that the effects are strongly seasonal. Yes, error bars are certainly inexact. They represent a measure of how much things deviate from what you expect, so depend on what you do expect - ie a model. I'm not sure that this difference between observing schemes would show as an error contribution provided that you do stick to one scheme consistently. Though clearly any carelessness with observing time would show up as error.
Nick,
ReplyDeletei have trouble recovering month from bottom graph, but would think the variances (if that's the right word) would be less during the time of year when day temp and night temps differ least.
Maybe that's obvious.
any views on this nick ? http://stevengoddard.wordpress.com/2014/07/16/another-smoking-gun-that-tobs-is-crap/#respond
ReplyDeletehttp://stevengoddard.wordpress.com/2014/07/16/tobs-even-worse-than-it-seems/
is the adjustment being applied the wrong way ? i cannot understand how a cooling trend in observations made in the morning and afternoon can turn into a warming trend once the tobs adjustment has taken place .
"any views on this nick ?"
DeleteIt made no sense. Can you figure what he's plotting? He says maximum summer temperature. I assume that is the year maximum of the recorded daily maximum temperatures. Why should that depend on time of observation?
that was my assumption too , what i could not understand is how it is possible for adjustments to get a warming trend for all data when the actual maximum temperature appears to be dropping over the time series ? again thanks for the reply. as a layman the reason i come here to ask questions is i believe i will get a reasoned and thought out reply and there is none of the name calling nonsense or diverted discussion that can be found on many other blogs.
Deletethanks,robert.
The historical record doesn't contain any 24-hour mean temperature; it consists mostly of a time series of last 24-hour min and max values read at 7:00-8:00 am or 4:00-5:00 pm. It would be nice to see a plot of the difference in temperatures (min and max) read at 8:00 am and 5:00 pm.
ReplyDeleteLooking at your plots of differences between the 24-hour mean temperature and the min/max temperature read once at day at a given hour, I'm struck by the inhomogeneity in the data. I wonder what would happen if various inhomogeneity correcting algorithms were fed data from the same station taken at different times. We believe that these algorithms are detecting and correcting events like station moves or other significant changes in the environment near the station. What if we compare the 8:00 am data to the 5:00 pm data from the same station? Will these algorithms detect a breakpoint in the data worthy of correction? For example, look at the change in the 5:00 pm data around 450 (vs the mean or other times).
Frank
NikFromNYC made some justified criticism here of a recent Goddard post on TOBS, but in terms which were, I'm afraid, a bit too personal (re other people) for this blog.
ReplyDelete"Censors on the left, censors on the right, here I am, back in the middle again."
Delete-=NikFromNYC=-
NikFromNYC: Every host has the right to run his blog as he sees fit, but it would be nice to be able to edit sections withoutre-typing. IMO, the science is what is important, not the personalities or their motivations.
DeleteFrank
Frank,
DeleteYes, I apologize for the comment input facility. It's what Blogger provides, and I haven't found any way to improve it. I just type my owns comments in an editor and paste.
I can't selectively snip comments either. I can only remove them completely if needed.