In my May TempLS posting I said that May seemed to be free from the big errors of some previous months. I'll note below that this was wrong, although there do seem to be fewer. Except for China, which turned out to have a lot of April data mixed in with May. China errors were not large enough to stand out individually, but together had a big effect.
It seems that the GHCN unadjusted file QCU, which I use, does not get the quality control that is advertised, but the adjusted file QCA does. Whether it is the stated QC process, or the cleanup needed for homogenisation, I don't know. But I wrote a program to make use of this. It notes where there is a QCU entry without a corresponding QCA. This need not be an error, so I check to see whether the QCU is then within 3 °C of a long term normal. If not, I exclude it. This would normally exclude a lot of good data, but the added condition of a missing QCA reduces that. And if some errors do get through, they won't be big ones.
This had a big effect on recent results, as I'll show. It is very much concentrated on the last twelve months. Whether that is because the initial error rate has grown, or because old errors get fixed with delay, I don't know. I do know that some very obvious errors back to 2010 remain.
I have only applied this to the last four years, because they are the ones I usually show. The most notable recent effect is that the drop of 0.14 °C from April to may has almost disappeared.
Here is the plot of the effect of fixing the errors. It shows after - before. It isn't pure for March and April 2014, because the "before" already had some fixing applied. The differences are fairly minor until April 2013, when there seems to have been a lot of stations in the US which did not get adjusted. Many had deviations slightly exceeding the 3°C threshold. It's not absolutely clear that these are errors, but they seem too numerous, and removing them makes a big difference. After that, the biggest changes are in 2014, with problems I discussed in earlier posts. In particular, the April average is now 0.609°C and May was 0.59°C - very little changed.
Update. I have added (at the end) a table of the data removed, and the reason.

I'll show comparison plots and discuss individual errors below the jump.
As I mentioned here, there was a big problem with China data. Most seemed to be copied from April. Whereas in other cases, I just removed suspect data, here I replaced it with long term averages for those stations. I mainly wanted to see what the effect would be.
There were a few others. Kazan in Russia was assigned an average of -79°C, when climatology says about 12. In this case, the CLIMAT entry had been removed. Aparri in the Philippines had 12.5°C instead of expected 28.3°C. And Cartagena, Colombia, had 39.1°C, about 10C too high. In this case, the mean exceed the max, so is clearly wrong.
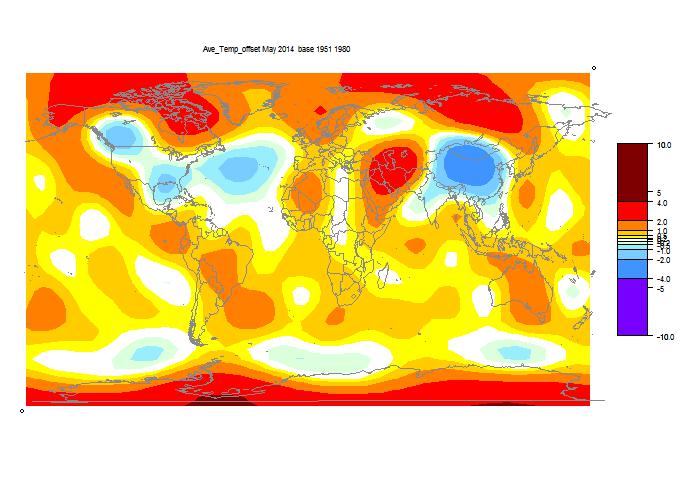
So here is the modified anomaly map (spherical harmonics) for the month:
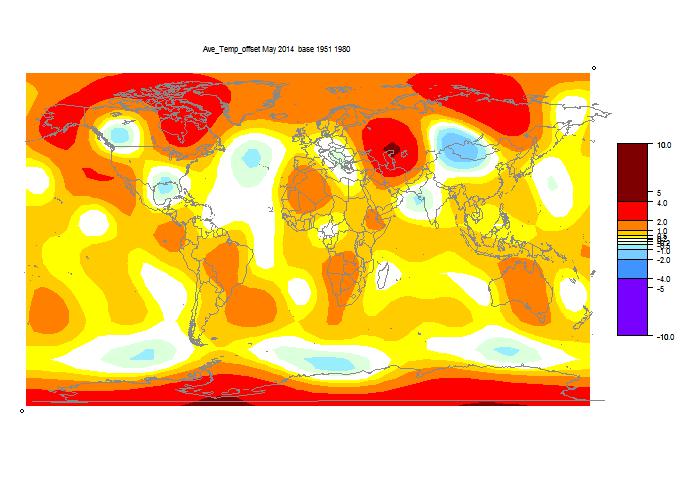
And here was the original, with the big China error:
Here is the GISS version:

Here are the old and new plots for recent months:
 |  |
Conclusion
Obviously, I wish GHCN would fix this. I wrote about six weeks ago, but no reply, and nothing has happened. I realize that I may be the only person who is trying to use GHCN unadjusted as soon as they appear. But if they can be fixed for the adjusted file, then why not QCU?I want to keep using QCU for TempLS. It's not that I doubt the value of the adjustments, but I think it is useful to have a demonstration that the unadjusted data really leads to much the same result. and it would do so more smoothly without these errors.
Update: A small mystery solved. I had noted that Port Hardy, on Vancouver Island, had been intermittently getting data from Clyde River, Nunavut. PH has GHCN number 40371109000, while CR is 40371090000.
Update: Here is a table of the data removed. ΔT is the temperature difference between the reading and the normal for that station/month.


What is gone in 60 seconds? The skeptic love affair with tempLS.
ReplyDelete