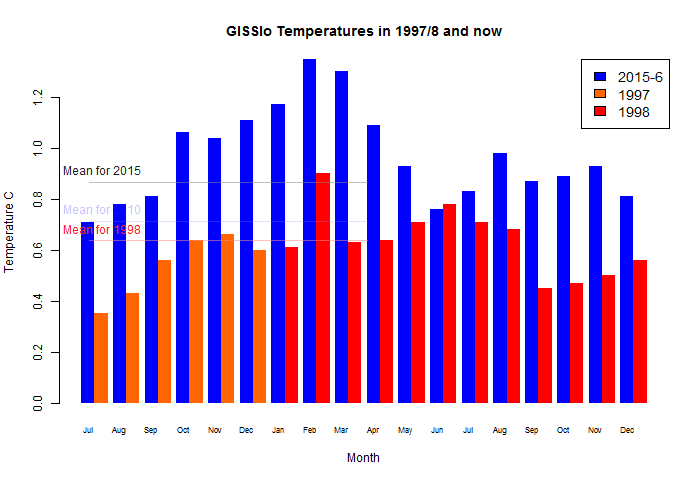
Here is a plot of the comparison with 1998. In that year, March dropped a lot from the February peak, but then recovered somewhat.
I'll show the world GISS map below the fold. It shows the same general pattern as TempLS; a band of warmth from Europe through Russia to the East, and another through Alaska to central Canada, plus Arctic. General warmth in Africa, Australia and Brazil. Colder spots in Labrador, Argentina, Antarctica and the N Pacific.
Here is the GISS map (from here):

And here is the corresponding TempLS spherical harmonics plot:


The temperatures are impressing. The last six months in Gistemp are more than 0.5 C warmer than corresponding months 1997-1998, an el Nino with at least the same strength. This peak to peak increase is more than the CMIP5 rcp 8.5 model average, which for a mixed SST/ land 2 m suggest an increase of 0.38 C ( or a trend of 0.21 C/decade) between 1998 and 2016.
ReplyDeleteGistemp has a new more elaborated station finder, and I found something that puzzles me. According to the reanalyses there has been a hotspot in the area between Svalbard and Taymyr peninsula since November, with temperatures 10-15 degrees above normal.
GHCN3 has now discarded two Russian stations in the center of this hotspot, Krenkel station in Franz Josef Land and Ostrov Vize, during this hot period. This cools the area substantially and also the global temps slighty. Data from those stations are approved by WMO/ shown in CLIMAT messages and used by JMA. They are hot but not hotter than the reanalyses suggest. I have checked with a number of stations in the Svalbard archipelago, and especially the automatized stations in the eastern part suggest that the heat is real.
GHCN v3 adjustments of Arctic stations are known for their cooling bias, all the way from Svalbard eastward through Alaska, but simply removing data was something new. I wonder how GHCN v4 beta handles this?
I dont believe in the alternative hypothesis, that spurious data from two Russian stations has fooled the reanalyses. They ingest data from several other sources, satellites, automatic weather stations, Arctic buoys etc..
Olof,
DeleteYes. You can see the effect here. GHCN has those ststions.
I notice there a rather perverse effect of TempLS ice treatment that I'm not sure how to handle. I disregard SST values less than -1°C. ERSST assigns sea ice as -1.8 (melting point in sea water), and I think has a scheme of setting part frozen toward that. But in a warm year like now, quite a lot of usually frozen sea is showing a reading just above -1, and so is assigned a small anomaly. In a colder year, it would have been assigned NA, and so in effect interpolated mostly from land, at much higher anomaly. For example, in Jan there was a temperature of -0.91 at 80N, 88E, with anomaly 0.89, and that cools a lot of Arctic. I think that is partly why TempLS in March shows moderate warmth in Arctic, while GISS has very warm.
Olof,
DeleteI did some checking of GMO IM.E.T. (Franz Josef) It has GHCN V3 unadjusted data to date. But adjusted data has been removedsince October 2015, with an X flag,of which they say:
"X = pairwise algorithm removed the value because of too many inhomogeneities."
Nick,
Delete"..too many inhomogeneities." Well, the cut off criteria can be discerned now:
4 months with anomalies averaging more than +10 C in two nearby stations is OK.
5 months with anomalies averaging more than +10 C in two nearby stations is NOT OK
The GHCN algorithms seems to be conservative, reducing locally extreme trends or cutting off extreme local values. However, in a warming world, especially in the rapidly warming Arctic, such conservation means a cooling bias.
Since I saved Gistemp February zonal means before the removal of Frans Josef and Ostrov Vize data it is possible to do a comparison and quantify the effect..
The removal of those two stations have caused a cooling of -0,69 C for the area north of 76 degrees. For the global temp anomaly this is exactly -0.01 C
No big deal...
Olof: you could look at the MERRA, MERRA2 or JMA reanalyses. I don't think any of them use land station temperatures.
ReplyDeleteOK Kevin, I will use KNMI climate explorer that have MERRA data through Feb.
ReplyDeleteAnomalies in February 2016. (1981-2010) for the area 80-82 N, 56-60 E (Krenkel station):
MERRA: +7.1 C
NCEP/NCAR: +18.2
ClimatView station data: +13.1
The nearest Svalbard station with a normal, Hopen, has +10,7 C
http://www.yr.no/place/Norway/Svalbard/Hopen_observation_site/statistics.html
Kevin, GHCN v3.3 (adjusted) has discarded all data from Krenkel and Ostrov Vize stations since November.
At least February data are missing in Hadcrut4 as well.
I made this zonal comparison two weeks ago:
https://drive.google.com/open?id=0B_dL1shkWewaOFptbnlKZDU3OVE
However, after the data removal Giss is now more than 1 C cooler North of 80 degrees:
http://data.giss.nasa.gov/tmp/gistemp/NMAPS/tmp_GHCN_GISS_ERSSTv4_1200km_Anom2_2016_2016_1961_1990_100__180_90_0__2_/amaps_zonal.png
Kevin, is it justified to remove recent data from Krenkel and Ostrov Vize stations?
Do You think that GHCN v4 beta handles the data differently? (having more Arctic stations supporting that the fast warming trends and "hotspots" are real and not spurious)
Well, there are two possibilities.
ReplyDelete1. An inhomogeneity in the station records which has now accumulated enough months to provide evidence for the data to be removed, or
2. A genuine high temperature which is being removed because it is so high that it looks like an inhomogeneity.
It's hard to tell. The reanalyses are one additional source of evidence.
I don't have time to look at this, but my next step would be to look at the zonal temperatures from GHCNv3 and v4, raw and adjusted. You can do that in the SkS temperature calculator here:
http://www.skepticalscience.com/tempcalc.php
... almost. Unfortunately it doesn't read the v4 files because they switched to alphanumeric station IDs. I'll look at patching that.
Try this version:
Deletehttp://www.ysbl.york.ac.uk/~cowtan/applets/temp/tempcalc.html
Thanks Kevin, I'll give it a try when I get home to my PC..
ReplyDelete