Sunday, October 22, 2017

Averaging and error propagation - random walk - math

I have been arguing again at WUWT. There is a persistent belief there which crops up over and over, that averages of large numbers of temperatures must have error estimates comparable to those for their individual components. The usual statement is that you can't make a bad measure good just by repeating over and over. I try to point out that the usually criticised climate averages are not reached by repeating one measure many times, and have invited people to identify the occurrence of such a problem that concerns them, without success.

I dealt with a rather similar occurrence of this issue last year. There I showed an example where Melbourne daily maxima given to 1 decimal (dp) were averaged over a month, for several months, and then averaged again after rounding to nearest integer. As expected, the errors in averaging were much less than 1°C. The theoretical is the standard deviation of the unit uniform distribution (sqrt(1/12) approx 0.29, divided by the sqrt of the number in the average, and the results were close. This time I did a more elaborate averaging with a century of data for each month. As expected this reduced the error (discrepancy between the 1dp mean and the 0dp mean) by a factor of 10.

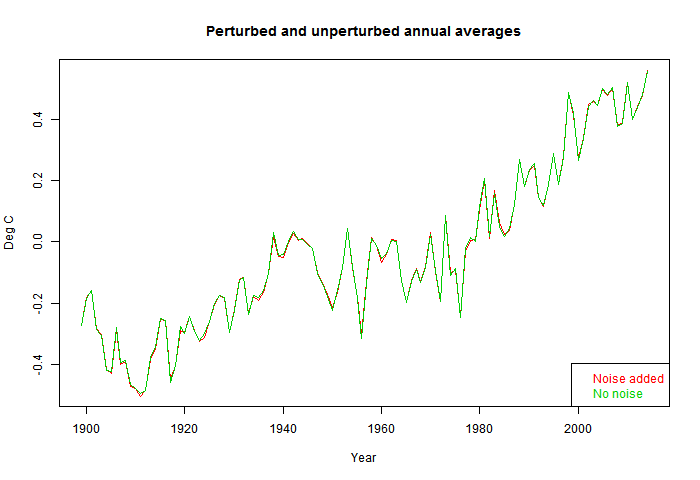
I also showed here that for the whole process of averaging over time and globally over space, adding white noise to all monthly averages of amplitude 1°C made almost no difference to the global anomaly time series.


The general response that there is something special about the measurement errors which would make them behave differently to the rounding change. And there are usually arguments about whether the original data was really as accurate as claimed. But if one could somehow have perfect data, it would just be a set of rather similar numbers distributed over a similar range, and there is no reason to expect rounding to have a different effect. Nor is there any kind of variation that could be expected to have different effect to rounding, as long as there is no bias; that is, as long as the errors are equally likely to be up or down. If there is bias, then it will be propagated. That is why bias should be the focus.

Here is a table of contents for what is below the fold:

Wednesday, October 18, 2017

GISS September down 0.04°C from August.

GISS showed a small decrease, going from 0.84°C in August to 0.80°C in September (GISS report here). It was the fourth warmest September in the record. That decrease is very similar to the 0.06°C fall in TempLS mesh.

The overall pattern was similar to that in TempLS. Warm almost everywhere, especially across N America, and S America and Middle/near East. Cool spots in W Europe and N central Siberia.

As usual here, I will compare the GISS and previous TempLS plots below the jump.

Sunday, October 8, 2017

September global surface temperature down 0.06°C

TempLS mesh anomaly (1961-90 base) was down from 0.673°C in August to 0.613°C in September. This compares with the smaller drop of 0.02°C in the NCEP/NCAR index, and a substantial rise (0.12) in the UAH LT satellite index. UAH is up a lot in the last two months.

Despite the fall, most of the world looked pretty warm. Warmth in Canada, S America, near East, China. A cool spot in Siberia, but warmth in Antarctica, which contrasts with the earlier NCEP/NCAR report, which showed predominant cold. Here is the temperature map: :


Tuesday, October 3, 2017

September NCEP/NCAR global anomaly down 0.02°C from August

In the Moyhu NCEP/NCAR index, the monthly reanalysis average declined from 0.337°C in August to 0.317°C in September, 2017. It was again a very varied month; it looked as if it would come out quite warm until a steep dip about the 23rd; that cool spell then lasted until the end of the month.

The main feature was cold in Antarctica, so again we can expect this to be strongly reflected in GISS and TempLS, and less in NOAA and HADCRUT. Elsewhere, cold in Central Russia, but warm in the west; fairly warm around the Arctic.